

President Trump doubled U.S. tariffs on steel and aluminum imports into the US from 25% to 50%, effective June 4th, 2025. The move was said to be about protecting the American steel and aluminum industries, with administration officials citing national security and economic stability as primary motivations. The decision was welcomed by domestic steelmakers, who expect to benefit from reduced foreign competition and higher prices for their products but it is beginning to concern businesses who depend on steel and aluminum as inputs, from makers of homes to aluminum cans. This is begging the question, where is steel and aluminum actually made around the world and in the US as of 2025?
Who are we? Speed Commerce is an end-to-end provider of outsourced customer experience solutions for eCommerce retailers (including for Shopify and BigCommerce and more) as well as manufacturers, for close to 20 years. We grow our clients’ businesses by providing winning customer experience strategies such as 24/7/365 eCommerce customer service, order fulfillment, and warehousing – get a free quote from a fulfillment expert. Use our new tariff calculator, updated for 2025.
China’s Metal Empire
When it comes to steel and aluminum production, one country towers above all others – China. The numbers are indeed eye-opening and help explain why trade policies around these metals have become politically charged.
China’s Dominance in Numbers:
- Steel – 1.02 billion metric tons in 2023 (54% of global production)
- Aluminum – 43 million metric tons in 2024 (60% of global production)
To put China’s steel production in perspective, it produces more than the next 10 countries combined. In 2020, China became the first country in history to produce over one billion tons of steel in a single year—a milestone that underscores the scale of its industrial machine.
This dominance stems from several factors: massive investments in manufacturing infrastructure, access to raw materials (both domestic and imported), enormous internal demand from construction and manufacturing, and government support for heavy industry.
The Global Steel Picture
Apart from China, steel production is spread across several key regions, though none come close to matching China’s output.
| Country | 2024 Production (Million Tonnes) | Global Share | Change from 2023 |
|---|---|---|---|
| China | 1,005.1 | 52.9% | -1.7% |
| India | 149.6 | 7.9% | +6.3% |
| Japan | 84.0 | 4.4% | -3.4% |
| United States | 79.5 | 4.2% | -2.4% |
| Russia | 70.7 | 3.7% | -7.0% |
Regional Patterns:
- Asia produces nearly 70% of the world’s steel when including China, India, Japan, and South Korea
- Europe contributes about 7-8% of global production, with Germany leading at roughly 37 million tons
- North America relies heavily on both domestic production and imports to meet demand
India’s growth (+6.3% in 2024) reflects its booming infrastructure development, while declines in traditional producers like Japan and Russia signal shifting global dynamics.
Aluminum Is Even More Concentrated
If steel production is dominated by China, aluminum production is virtually monopolized by it. The energy-intensive nature of aluminum smelting has created an even more concentrated global picture.
| Country | 2024 Production (Thousand Tonnes) | Global Share |
|---|---|---|
| China | 43,000 | 59.7% |
| India | 4,200 | 5.8% |
| Russia | 3,800 | 5.3% |
| Canada | 3,300 | 4.6% |
| UAE | 2,700 | 3.7% |
Why Geography Matters for Aluminum: Aluminum smelting requires enormous amounts of electricity—about 14,000-15,000 kWh per ton. This has driven production toward regions with cheap, abundant power:
- Canada and Norway: Hydroelectric power
- Middle East (UAE, Bahrain): Low-cost natural gas
- China: Historically coal-based power (transitioning to renewables)
- Iceland: Geothermal energy
Europe’s aluminum production has actually declined dramatically since 2021 due to soaring energy costs, with over 1 million tons of annual capacity curtailed during the energy crisis.
Steel in America: Rust Belt to Modern Mills
The United States is still a major steel producer, ranking fourth globally with 79.5 million tons in 2024. But the geography and methods of American steelmaking have evolved dramatically.
Geographic Concentration:
- Indiana leads the nation, producing over 22 million tons annually (about 25% of US total)
- Ohio follows with approximately 10 million tons
- Pennsylvania, Michigan, Illinois round out the traditional “Rust Belt” production centers
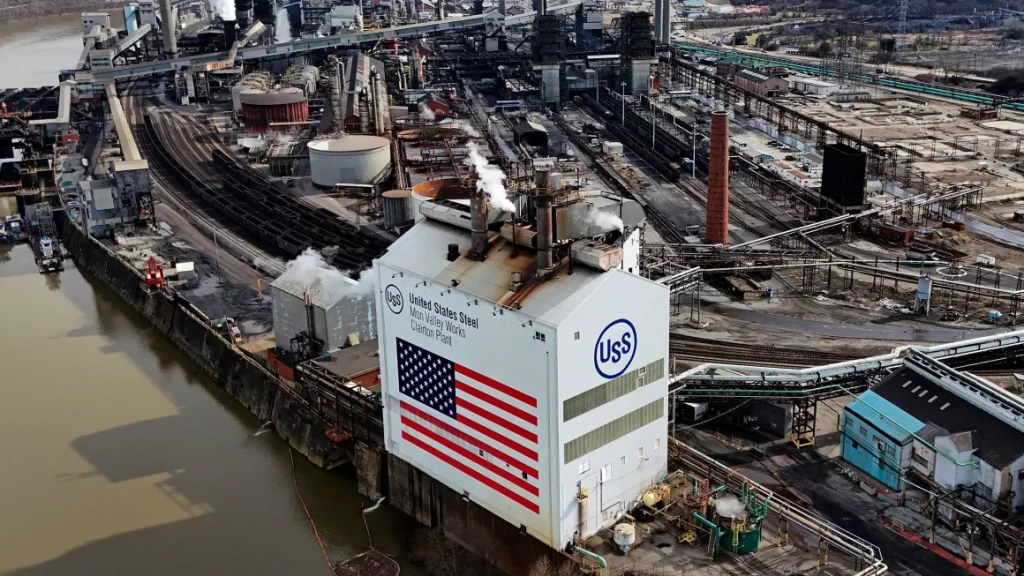
Indiana’s dominance comes from massive integrated mills along Lake Michigan, including U.S. Steel’s Gary Works and Cleveland-Cliffs’ Indiana Harbor complex. These facilities benefit from direct shipping of iron ore across the Great Lakes and proximity to Midwest automotive manufacturers.
The Mini-Mill Revolution: An important development is transforming American steelmaking. While traditional blast furnaces still operate in the Great Lakes region, about 70% of US steel now comes from electric arc furnace (EAF) “mini-mills” that melt scrap metal rather than processing iron ore. Companies like Nucor and Steel Dynamics operate dozens of these facilities across the country, essentially turning America’s steel industry into a massive recycling operation.
America’s Aluminum Challenge
While the US maintains a substantial steel industry, its aluminum story is one of dramatic decline. The contrast is stark and helps explain current trade tensions.
The Collapse:
- 2000: US was the world’s largest aluminum producer with 20+ smelters
- 2024: Only 4 smelters remain, producing just 670,000 tons (1% of global output)
- Import dependence: 82% of US aluminum supply is imported
The Survivors: Only four US aluminum smelters still operate:
- Alcoa’s Warrick Operations (Indiana)
- Alcoa’s Massena plant (New York)
- Century Aluminum’s Mt. Holly (South Carolina)
- Century Aluminum’s Sebree (Kentucky)
Why the Decline? High electricity costs made US smelters uncompetitive against operations in China, Canada, and the Middle East. It became cheaper to import aluminum than produce it domestically, leading to steady plant closures throughout the 2000s and 2010s.
The US now imports about 5.5 million tons of aluminum annually, with over half coming from Canada. However, secondary (recycled) aluminum stands strong, about 78% of US aluminum production comes from recycling, which uses only 10% of the energy required for primary production.
Trade Wars and Tariff Battles
The concentration of steel and aluminum production in a few countries has made these metals a flashpoint for trade policy. Recent developments have intensified these tensions significantly.
The Tariff Escalation:
- 2018: US imposed 25% steel tariffs and 10% aluminum tariffs under Section 232
- June 2025: Tariffs doubled to 50% on steel and aluminum imports from Europe
- Rationale: National security concerns over import dependence
Immediate Impacts: The 50% tariffs have triggered swift reactions:
- European Union: Threatened $28.33 billion in retaliatory tariffs on US goods
- Canada: Warned of damage to integrated North American supply chains
- US Industries: Face higher costs for imported metals, potentially raising consumer prices
Supply Chain Disruption: For logistics companies and manufacturers, the tariffs create immediate challenges:
- Need to find alternative suppliers not subject to tariffs
- Potential increase in domestic sourcing if capacity allows
- Inventory strategies may shift to stockpile before price increases
- Freight patterns could change as trade flows redirect
Summary
The global view of steel and aluminum production shows a world of pretty severe imbalances. China’s dominance in both metals, producing over half the world’s steel and nearly two-thirds of its aluminum, has created dependencies that governments, led by the US, are moving to address through trade policy and domestic investment.
For the US, the contrast between steel and aluminum is interesting. While America maintains significant steel production capacity and produces most of what it consumes domestically, its aluminum industry has largely disappeared, creating heavy reliance on imports.
As the recent tariff battles demonstrate, these geographic imbalances have real consequences. Supply chains built over decades can be disrupted by policy changes, compelling companies to adapt sourcing strategies and logistics networks. Will steel tariffs alleviate these imbalances or are they simply being used as a negotiation tactic for trade deals? Will they hurt businesses and the wider economy in the meantime? These are questions that will play out in 2025 and beyond.
Sources and References
- World Steel Association data and World Steel in Figures 2024/2025
- American Iron and Steel Institute production data (2024)
- Indiana Economic Digest – U.S. steel production by state
- USGS and International Aluminium Institute data (2024)
- Industrious Labs report on U.S. aluminum import reliance (2025)
- Reuters coverage of EU tariff retaliation threats (June 2025)
- CNBC reporting on steel and aluminum tariff impacts (2025)
- Straits Research – Global Aluminum Market Analysis (2025)
- European Aluminum Association smelter closure data
- Various Wikipedia sources on steel and aluminum production by country